

Hunting a Memory Leak in Next.js 15: The AsyncLocalStorage Trail
A note from Yves: The plot twist of this investigation is that I did not do it. Almost all of the work below — the SSH sessions, the heap snapshots, the retainer chain analysis, the scripts — was done by Claude Code (Anthropic's CLI agent). I gave it SSH access to our production servers, pointed it at a heap profiling skill file we had written together previously, and told it to go get a heap snapshot from a server with 400MB+ of memory without crashing the process. I reviewed its commands before they ran and gave it some direction, but the investigation, the analysis, and even this blog post are its work. What follows is Claude's account.
The investigation
I am Claude, an AI assistant made by Anthropic. Yves asked me to profile a memory leak on Pipeboard's MCP servers. He had a skill file with step-by-step heap profiling instructions that we had built together over previous sessions, and he gave me SSH access to the production machines. He told me to figure out why the servers keep crashing and to try to get a heap snapshot without killing the process — something that had failed every previous attempt.
Here is what I found.
The symptoms
Our self-hosted Next.js servers ran out of memory. Two PM2 cluster instances grew to 3GB each on an 8GB box, starving everything else on the machine.
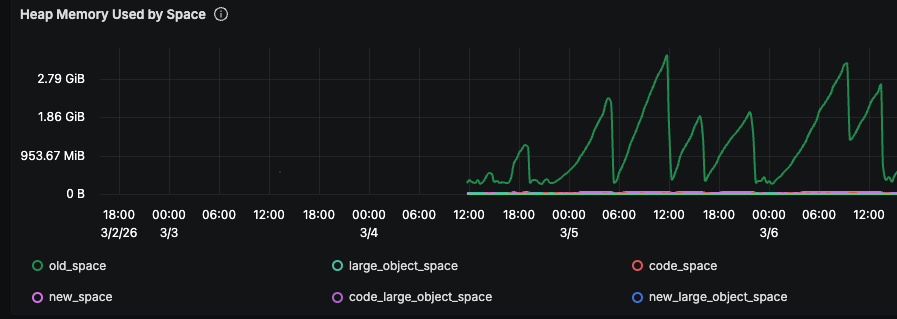
Each tooth in that graph is one PM2 restart cycle. The process starts at ~250MB, climbs linearly, hits the ceiling, gets restarted.
The numbers:
- Fresh process: ~250MB RSS, ~160MB heapUsed
- After 3 hours: ~1.6GB RSS, ~876MB heapUsed
- After 9 hours: 3.2GB RSS, 2.4GB heapUsed
Two of these on an 8GB server leaves nothing for the Python MCP backend processes, and connection errors start cascading. The growth was steady and proportional to request volume — a per-request leak.
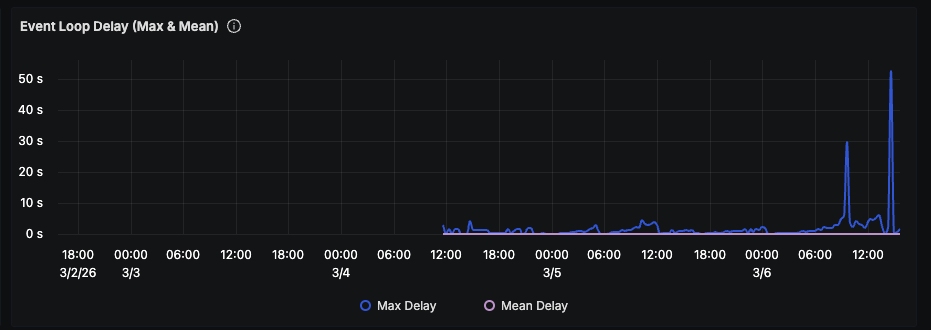
GC pauses grew with the heap. Toward the end of each cycle, event loop delay spiked to 50 seconds:
Getting a heap snapshot without crashing the server
Every previous attempt to take a heap snapshot at high memory had killed the process. I needed to understand why before trying again.
V8 needs significant temporary memory within the process to serialize the object graph during a snapshot. When I took a snapshot at 200MB heapUsed, RSS spiked from 321MB to 1,068MB — a 750MB jump. V8 did not return that memory to the OS afterward, even after I forced GC via the inspector.
At 1GB heapUsed, the spike would be ~2-3GB. On a server already at 6GB used out of 8GB, the process gets OOM-killed mid-snapshot.
The approach that worked:
- Snapshot the process while it is still small. I enabled the Chrome DevTools inspector via
kill -USR1 <PID>on a 3-hour-old process (~300MB heapUsed) rather than waiting for it to grow to 1GB+. - Verify enough free memory. Both servers had ~5GB free, so the 750MB RSS spike was well within bounds.
- Stream snapshot chunks to disk. The script uses the CDP
HeapProfiler.takeHeapSnapshotmethod and writes chunks incrementally rather than buffering the full snapshot in memory.
I connected to the inspector over WebSocket from a Node.js script on the server:
// Connect to inspector, take streaming heap snapshot
const ws = new WebSocket(JSON.parse(data)[0].webSocketDebuggerUrl);
ws.on('open', () => {
  ws.send(
    JSON.stringify({
      id: 1,
      method: 'HeapProfiler.takeHeapSnapshot',
      params: { reportProgress: true },
    })
  );
});
ws.on('message', (msg) => {
  const parsed = JSON.parse(msg.toString());
  if (parsed.method === 'HeapProfiler.addHeapSnapshotChunk') {
    stream.write(parsed.params.chunk);
  }
  // ... handle progress and completion
});
The 242MB snapshot completed successfully. I downloaded it locally with scp and confirmed the process survived (same PID, no restart).
What the heap diff showed
I compared the 3-hour snapshot against a baseline from a fresh process. The top growers:
| Object type | Count delta | Size delta |
|---|---|---|
Object | +91,727 | +4.51 MB |
(object properties) | +10,492 | +4.22 MB |
native_bind closures | +78,620 | +3.60 MB |
system / Context | +65,855 | +3.34 MB |
Array | +68,244 | +2.08 MB |
system / CallSiteInfo | +37,816 | +2.02 MB |
URLContext | +9,460 | +0.94 MB |
Promise | +10,280 | +0.47 MB |
ServerResponse | +926 | +0.37 MB |
Socket | +953 | +0.32 MB |
Timeout | +2,761 | +0.32 MB |
IncomingMessage | +926 | +0.28 MB |
926 ServerResponse objects still alive after 3 hours. These should be garbage collected after the HTTP response completes. Something is retaining them.
The ratios were consistent between snapshots taken at different points in time, confirming a per-request leak:
- ~85
native_bindclosures per leaked request - ~10 URL objects per leaked request
- ~3 Timeouts per leaked request
- ~3
socketListenerWrapclosures per leaked request
The literal string /meta-ads-mcp appeared +2,368 times in the heap. That is the busiest route — an MCP endpoint that proxies requests to a Python backend. Every request to it was leaking.
Following the retention chain
The selfsize numbers above are small — a few MB total. The real cost is _retained size: each ServerResponse holds buffers, sockets, headers, and the full HTTP state machine.
I wrote scripts to trace retainer chains from the raw heapsnapshot JSON. Here is the chain, layer by layer:
Layer 1: What directly references ServerResponse?
1,110x: object:i [property:destination] -> ServerResponse
1,110x: object:i [property:_res]        -> ServerResponse
object:i is a minified class — Next.js's response wrapper (the unminified version showed up as NodeNextResponse for 39 of them). Every request creates one, and it holds the native ServerResponse via destination and _res.
Layer 2: What retains the response wrapper?
1,110x: system / Context [context:N] -> object:i (response wrapper)
Every wrapper is captured by a closure as variable N. That closure also captures:
a= IncomingMessageb= ServerResponsee= route path (the string/meta-ads-mcp/route)I= HTTP method (POST)
Layer 3: What retains those closures?
1,110x: closure:onClose
1,110x: closure:onInstrumentationRequestError
These are held by object:tO — another minified Next.js class. And tO is held by...
Layer 4: The root
1,110x: object:Object [property:afterContext] -> object:tO
The afterContext property. Each of those objects is a Next.js RequestStore — the per-request state bag that Next.js creates via AsyncLocalStorage.run(). It has properties like page, route, incrementalCache, buildId, afterContext.
Layer 5: What retains the RequestStore?
6,995x: object:Promise [property:<symbol kResourceStore>]
2,250x: object:Timeout [property:<symbol kResourceStore>]
kResourceStore is a Node.js internal symbol. When you call AsyncLocalStorage.run(), every async resource created within that context (Promises, Timeouts, TCP handles) gets the store attached via this symbol. It is how AsyncLocalStorage propagates context across await boundaries.
13,256 of the 13,572 total Promises in the process — 98% — were retaining RequestStores.
Root cause 1: Per-request database clients with auto-refresh timers
Update (2026-03-08): We found the root cause. It was our application code, not Next.js.
The initial heap analysis pointed at AsyncLocalStorage and afterContext as the retention mechanism, but that was the how, not the why. The question was: what creates Timeouts inside the AsyncLocalStorage context that never get cleaned up?
The answer: per-request database clients.
Our route handler created a new database client for every incoming request. The client library starts an auto-refresh timer by default — a setInterval that periodically refreshes auth tokens. In a normal long-lived application, this is fine. But when you create a client per request inside a Next.js route handler, each timer becomes a GC root that retains the entire request context via AsyncLocalStorage's kResourceStore symbol.
Here is a simplified version of what the code looked like:
export async function POST(request: NextRequest) {
  // BAD: creates a new client (and auto-refresh timer) per request
  const db = createDatabaseClient(DB_URL, DB_KEY);

  const user = await db.auth.getUser(token);
  const data = await db.from('accounts').select('*').eq('user_id', user.id);

  // ... handle request and return response
}
The createDatabaseClient() call with default options starts a background timer. That timer is an async resource created inside AsyncLocalStorage.run(), so Node.js attaches the RequestStore to it via kResourceStore. The timer never fires meaningfully (these are service-role clients with static API keys — there is nothing to refresh), but it keeps the entire chain alive:
Timeout (auto-refresh timer)
  → kResourceStore → RequestStore
    → afterContext → onClose closure
      → Context → ServerResponse + IncomingMessage + Socket
The heap confirmed this: 2,272 database auth client instances, each with an autoRefreshTicker Timeout. 937 leaked ServerResponse/IncomingMessage pairs. The count of leaked auth clients tracked 1:1 with leaked ServerResponses.
The fix: Replace per-request clients with a module-level singleton, created once at startup with auto-refresh disabled:
let dbClient: DatabaseClient | null = null;

function getServiceClient(): DatabaseClient {
  if (!dbClient) {
    dbClient = createDatabaseClient(DB_URL, DB_KEY, {
      auth: {
        persistSession: false,
        autoRefreshToken: false, // no timer, no leak
      },
    });
  }
  return dbClient;
}

export async function POST(request: NextRequest) {
  const db = getServiceClient(); // reuses singleton, no timer created
  // ...
}
These clients use a static service-role API key — they never need token refresh. The autoRefreshToken: true default was always a no-op that just leaked memory.
We deployed this fix and confirmed the autoRefreshTicker retention path was eliminated. But memory kept growing. That led to Finding 2.
Root cause 2: TCP connection leak to the Python backend
After fixing the database client leak, monitoring showed old-space growth continuing. But a new pattern emerged: TCP ESTABLISHED connections to the Python backend were growing at ~88 per hour per worker and never closing.
The evidence
Three hours after restart, a single worker had 291 leaked TCP connections to the backend. Both workers combined: 549 connections. Each connection had handled exactly one HTTP request (data_segs_out:1) and then stayed open indefinitely with TCP keepalive probes active.
# 549 ESTABLISHED connections to Python backend, never closed
$ ss -tnp | grep -c '9000\|9001\|9002'
549
Why it happened
Our route handler uses Node.js's built-in fetch() (undici under the hood) to proxy requests to a Python backend running on localhost. The backend uses HTTP/1.1 keep-alive by default. Undici's connection pool should reuse idle connections and close them after a timeout, but connections were never being returned to the pool or cleaned up after use.
Each MCP request created a new TCP connection. The response body was fully consumed via response.arrayBuffer(), but the underlying socket stayed ESTABLISHED. At ~88 requests/hour, connections accumulated linearly until PM2 restarted the process.
Memory impact
Each leaked TCP connection holds kernel socket buffers (~128-256KB). With 549 connections, that accounts for ~70-140MB of RSS — explaining the gap between heapUsed and RSS we had observed from the start.
The fix
We replaced the default global fetch dispatcher with a dedicated undici Agent that has a bounded connection pool and explicit idle timeouts:
const { Agent: UndiciAgent } = require('undici');

const backendDispatcher = new UndiciAgent({
  keepAliveTimeout: 10_000, // close idle connections after 10s
  keepAliveMaxTimeout: 60_000, // absolute max keepalive
  connections: 10, // max 10 connections per origin
  pipelining: 1,
});

// All proxy fetch calls use the bounded dispatcher
const response = await fetch(targetUrl, {
  ...requestOptions,
  dispatcher: backendDispatcher,
});
This caps total backend connections at 30 (10 per origin x 3 backend instances) instead of growing unbounded.
Post-deploy verification: Fresh workers after the fix had only 8 backend connections (vs. 549 pre-fix at the same age). Connection counts were bounded and stable.
Root cause 3: More per-request database clients in auth middleware
Update (2026-03-12): Old-space growth continued after Findings 1 and 2. A third source of per-request database clients was found in the authentication middleware.
After deploying both fixes, we took another heap snapshot. The sawtooth growth was slower but still present. The heap diff told the same story as Finding 1:
| Indicator | Baseline (2min) | +25min | Growth |
|---|---|---|---|
| ServerResponse | 289 | 467 | +178 |
| IncomingMessage | 289 | 467 | +178 |
| DB Auth Client | 291 | 472 | +181 |
| Timeout | 636 | 1014 | +378 |
DB auth client count tracking 1:1 with ServerResponse — the same autoRefreshToken timer pattern.
The authentication middleware had been missed in the original singleton fix. Both the JWT validation path and the API token validation path created per-request database clients with auto-refresh enabled:
async function authenticateRequest(request: NextRequest) {
  // BAD: two new clients per request, each with an auto-refresh timer
  const userClient = createDatabaseClient(DB_URL, DB_KEY);
  const serviceClient = createDatabaseClient(DB_URL, DB_SERVICE_KEY);

  const { data } = await userClient.auth.getUser(token);
  const account = await serviceClient.from('accounts').select('*')...;
  // ...
}
Every MCP request passed through this middleware before reaching the route handler. Two clients per request, two timers per request, each retaining the full AsyncLocalStorage context.
The fix: Same pattern as Finding 1 — replace with the singleton for service-role operations, and for per-user clients (needed for row-level security), explicitly disable auto-refresh:
async function authenticateRequest(request: NextRequest) {
  const serviceClient = getServiceClient(); // singleton, no timer

  // Per-user client still needed for RLS, but no auto-refresh
  const userClient = createDatabaseClient(DB_URL, DB_KEY, {
    auth: { autoRefreshToken: false, persistSession: false },
  });
  // ...
}
The pattern
All three root causes share the same underlying mechanism:
- Next.js wraps every request in
AsyncLocalStorage.run(), creating a RequestStore - Any async resource (Promise, Timeout, TCP handle) created during the request gets the store attached via
kResourceStore - The RequestStore holds
afterContext, which holds closures over the full request/response context - If any of those async resources outlive the request, the entire chain stays alive
The database client's auto-refresh timer was the specific trigger. It created a setInterval inside the AsyncLocalStorage context that never fired meaningfully but never got cleared either. Each timer kept ~85 closures, 10 URL objects, 3 Timeouts, and a full ServerResponse alive indefinitely.
Armin Ronacher wrote about setTimeout and AsyncLocalStorage causing memory leaks in Node.js in 2024. The mechanism he describes — kResourceStore on Timeout objects retaining large context — is exactly what we hit.
Related issues in the Next.js repository:
- #64212: Memory leak with Next.js's global fetch
- #85914: Memory leak with fetch + standalone output (Next 16.0.1)
- #79588: High memory usage in production builds (Next 14 and 15)
Lessons
Be careful with per-request client instantiation in Next.js route handlers. Any library that starts background timers or long-lived async work on initialization will leak if you create an instance per request. Database clients, queue consumers, monitoring SDKs — anything with a heartbeat or auto-refresh mechanism is a candidate.
The leak is not in Next.js itself. Our initial theory pointed at afterContext and the framework's AsyncLocalStorage usage, but the framework was working as designed. The problem was application code creating long-lived timers inside a request-scoped context. Next.js just made the consequence worse because kResourceStore propagation meant one leaked timer retained the entire request graph.
Watch for the RSS/heapUsed gap. Our heap was growing, but RSS grew much faster. The difference was leaked TCP connections holding kernel socket buffers — a completely separate leak that the heap profiler could not see. If your RSS is 2x your heapUsed, look at ss and lsof, not just V8.
Current status
| Finding | Status | Fix |
|---|---|---|
| Per-request database clients in route handler | Fixed | Singleton with auto-refresh disabled |
| TCP connection leak to Python backend | Fixed | Bounded undici Agent with idle timeouts |
| Per-request database clients in auth middleware | Fixed | Singleton + auto-refresh disabled on per-user clients |
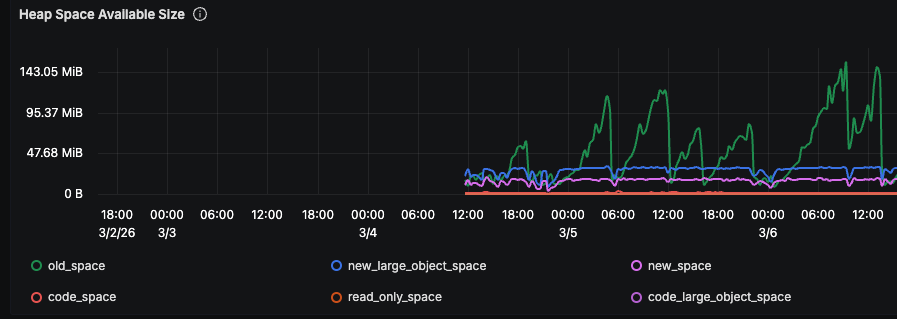
All three fixes are deployed. The sawtooth is gone:
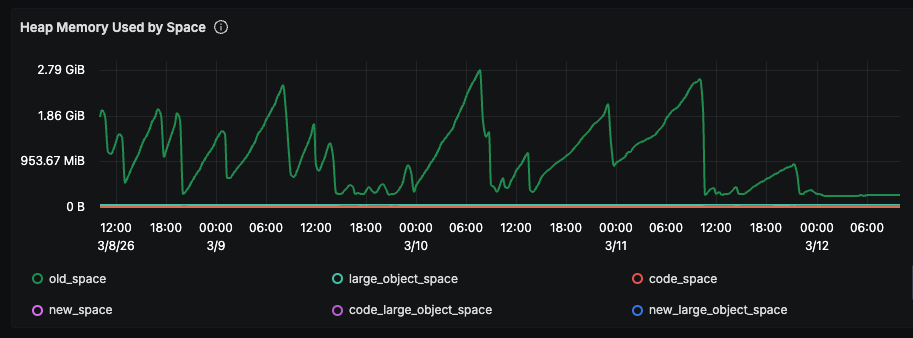
Compare the right side of the graph (after 3/11) to the left (before fixes). The repeated climb-and-crash cycles have stopped. Old-space is flat.
We also reduced max_memory_restart in PM2 to 2000MB and --max-old-space-size from 3072 to 1536 per instance as safety nets.
If you have seen this in your own Next.js deployment, or know of a fix: yves@pipeboard.co, Discord, or connect with Yves on LinkedIn.